I see that there’s a new Course Signals press release out that claims Course Signals boosts graduation rate 21%. Or, more exactly, it claims taking *two* classes using Course Signals boosts graduation rates by 21%.
Why does it claim that? Well, I haven’t looked at the new data, but I did look at it last year, and assuming the trends didn’t change it’s because taking *one* CS course correlates with a *lower* retention rate than the non-CS population.
(Note that Purdue has since moved this study off their site). UPDATE: Found a version of this study, moved here.
The press release then contains this maddening quote:
“For some reason, two courses is the magic number. Taking just one course with Course Signals is beneficial for students, but we’ve seen significant improvement when students are enrolled in at least two courses using the system,” Pistilli says.
“We need to continue to do more research on why this is significant,” Pistilli continues. “We think it is because if a student gets feedback from two different instructors, they can make better links between their performance and their behaviors. For example, a student may be taking a course in biology and and another in communications, which are very different courses, but if they get the same feedback in both courses about study habits and needing to spend more time on task – and they hear suggestions on how to improve from two different professors – they appear to make the change. What’s notable is that this improvement stays with them in their other courses and for the rest of their academic careers.”
Ok, that’s a great theory about the “magic number”. But I actually have another one.
Only a portion of Purdue’s classes are Course Signals classes, so the chance any course a freshman takes is a Course Signals course can be expressed as a percentage, say 25%. In an overly dramatic simplification of this model, a freshman who takes four classes the first semester and drops out has a has about a 16% chance of having taken two Course Signals courses (as always, beware my math here, but I think I’m right). Meanwhile they have a 74% chance of having taken 1 or fewer, and a 42% chance of having taken exactly one.
What about about a student who does *not* drop out first semester, and takes a full load of five courses each semester? Well, the chance of that student having two or more Course Signals courses is 75%. That’s right — just by taking a full load of classes and not dropping out first semester you’re likely to be tagged as a CS 2+ student.
In other words, each class you take is like an additional coin flip. A lot of what Course Signals “analysis” is measuring is how many classes students are taking.
Are there predictions this model makes that we can test? Absolutely. As we saw in the above example, at a 25% CS adoption rate, the median dropout has a 42% chance of having taken exactly one CS course. So it’s quite normal for a dropout to have had a CS course. But early on in the program the adoption rate would have much lower. What are the odds of a first semester dropout having a CS course in those early pilots? For the sake of argument let’s say adoption at that point was 5%. In that case, the chance our 4-course semester drop out would have exactly one CS course drops from 42% to 17%. In other words, as adoption grows having had one course in CS will cease to be a useful predictor of first to second-year persistence.
Is that what we see? Assuming adoption grew between 2007 and 2009, that’s *exactly* what we see. Here’s the early pilot days of Course Signals:
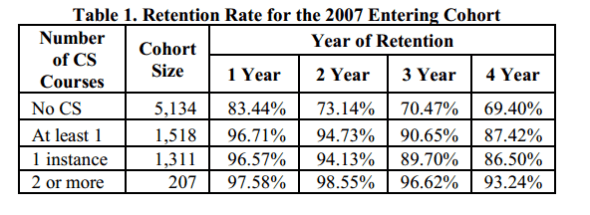
As you can see, in what were likely the lower adoption days taking one Course Signals course is a huge predictor of persistence. The one year retention rate is 97% for the one-CS course student, compared to just 83% for the no-CS student. As adoption expands, changing the median experience of the drop out, that difference disappears, just like the model predicts:

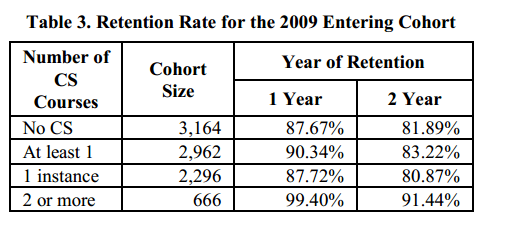
Two years later, that retention effect has disappeared entirely, with the same percentage of one-CS students dropping out as non-CS students. Why? Without access to dropout data, I can’t say for sure. But I submit a large part of the shift of one-CS as predictor of retention to one-CS as non-predictor is that having one-CS class is now the average experience of both low course-load students and first semester dropouts. The effect disappears because the confounding variable is no longer correlated with the dependent variable.
So, do I believe that Course Signals works? Maybe, it’s possible. There are other measures with grades and such that look a bit more promising. But the problem is that until they control for this issue, the percentage increases they cite might as well be random numbers. It would be trivially easy to account for these things — for example, by removing first semester dropouts from the equation, and only looking at students under full course load. When I looked at the (now removed) 2012 report, I saw nothing to indicate they had done these things. Now, in 2013, I still see nothing to indicate they have taken these factors into account.
I could be wrong. I’m a Literature and Linguistics M.A. who works in educational technology, not a statistician. But if I am right, this is sloppy, sloppy work.

Leave a comment